This post is a collection of FAQs regarding Crawl Maps, to help you better understand what they are showing you and how to interpret them.
We have a separate article with a bunch of Crawl Map examples, which includes some common patterns you can spot using Crawl Maps, such as pagination chains.
In graph theory parlance, a dot is referred to as a 'node' (or 'vertex'), and a line is referred to as an 'edge.'
In terms of what these represent in your Crawl Map:
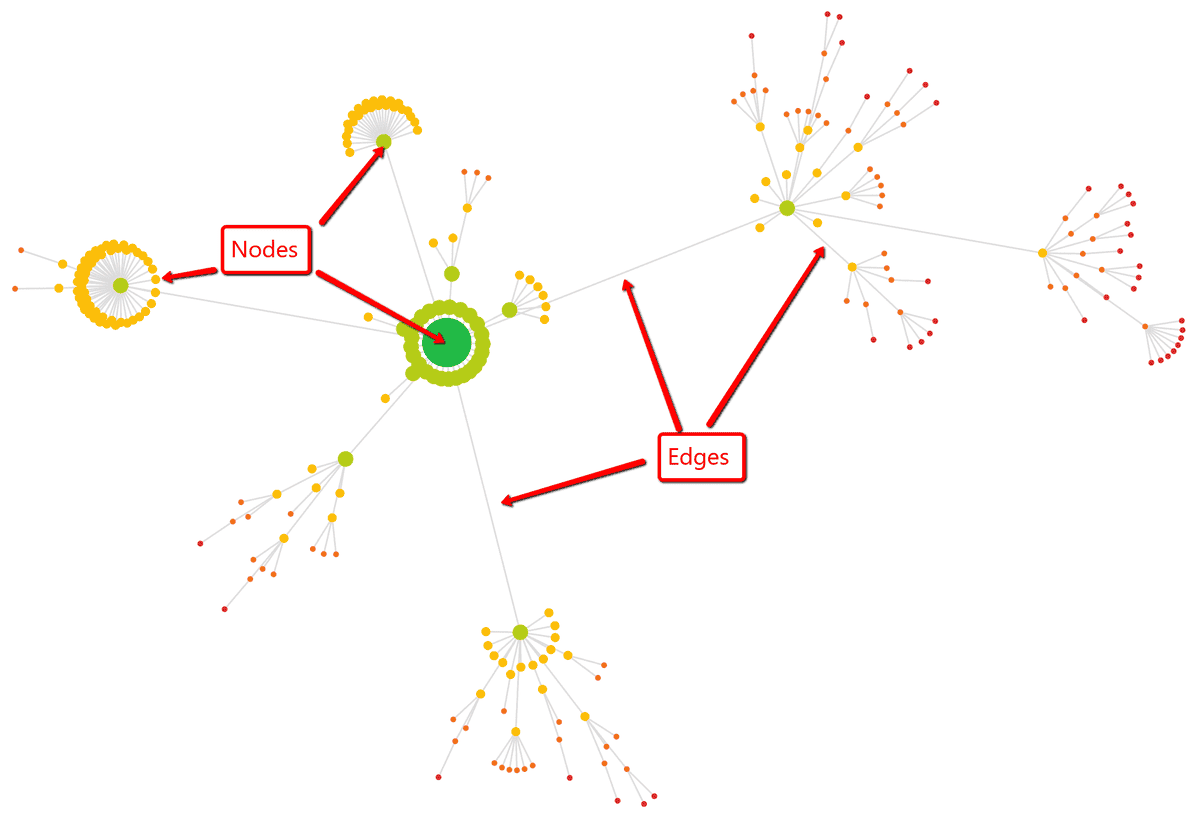
A Crawl Map is a type of 'directed graph', meaning that there is a direction associated with each edge. In particular, the direction is of an outgoing link from one URL to another.
You'll notice that any two nodes are only ever joined by one edge, even if a URL has many inlinks on the website. Essentially, all you are seeing is the first link found by the crawler, during its crawl. This is because the Crawl Map reflects the way in which Sitebulb crawled the website.
Since Sitebulb crawls using a breadth-first method, this means that URLs will appear to be linked from their 'highest' link, in terms of crawl depth.
For example, if you have product pages which are generally linked from sub-category pages, these would be 3 levels deep, but if a few of these products are also linked from the homepage, those specific URLs would display as 1 level deep.
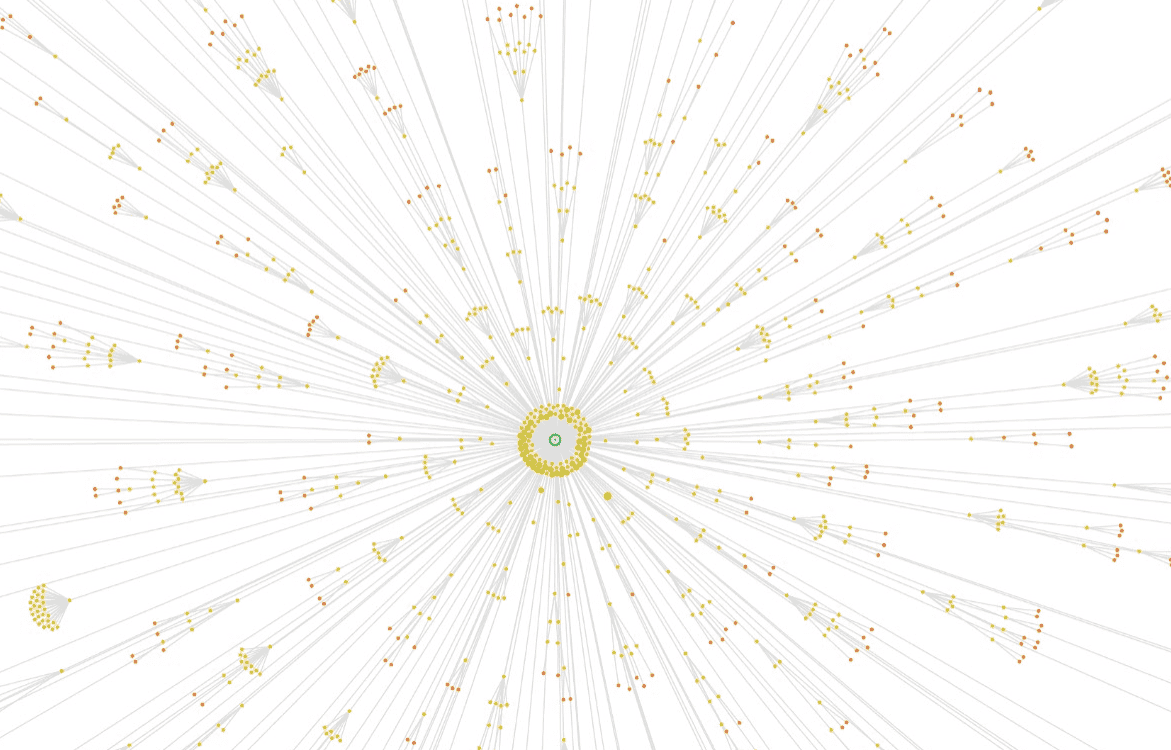
In early versions of Sitebulb we did this, but as soon as you crawl a site that is even remotely large, the Crawl Map becomes ridiculously unmanageable. This is an example of an early Crawl Map that we considered 'not that bad' at the time...
As a result, we implemented a number of rules to restrict which URLs can be shown in Crawl Maps:
Even with these rules in place, we found that some Crawl Maps would just shoot off in all directions, never-ending pagination chains causing crazy spiderweb graphs.
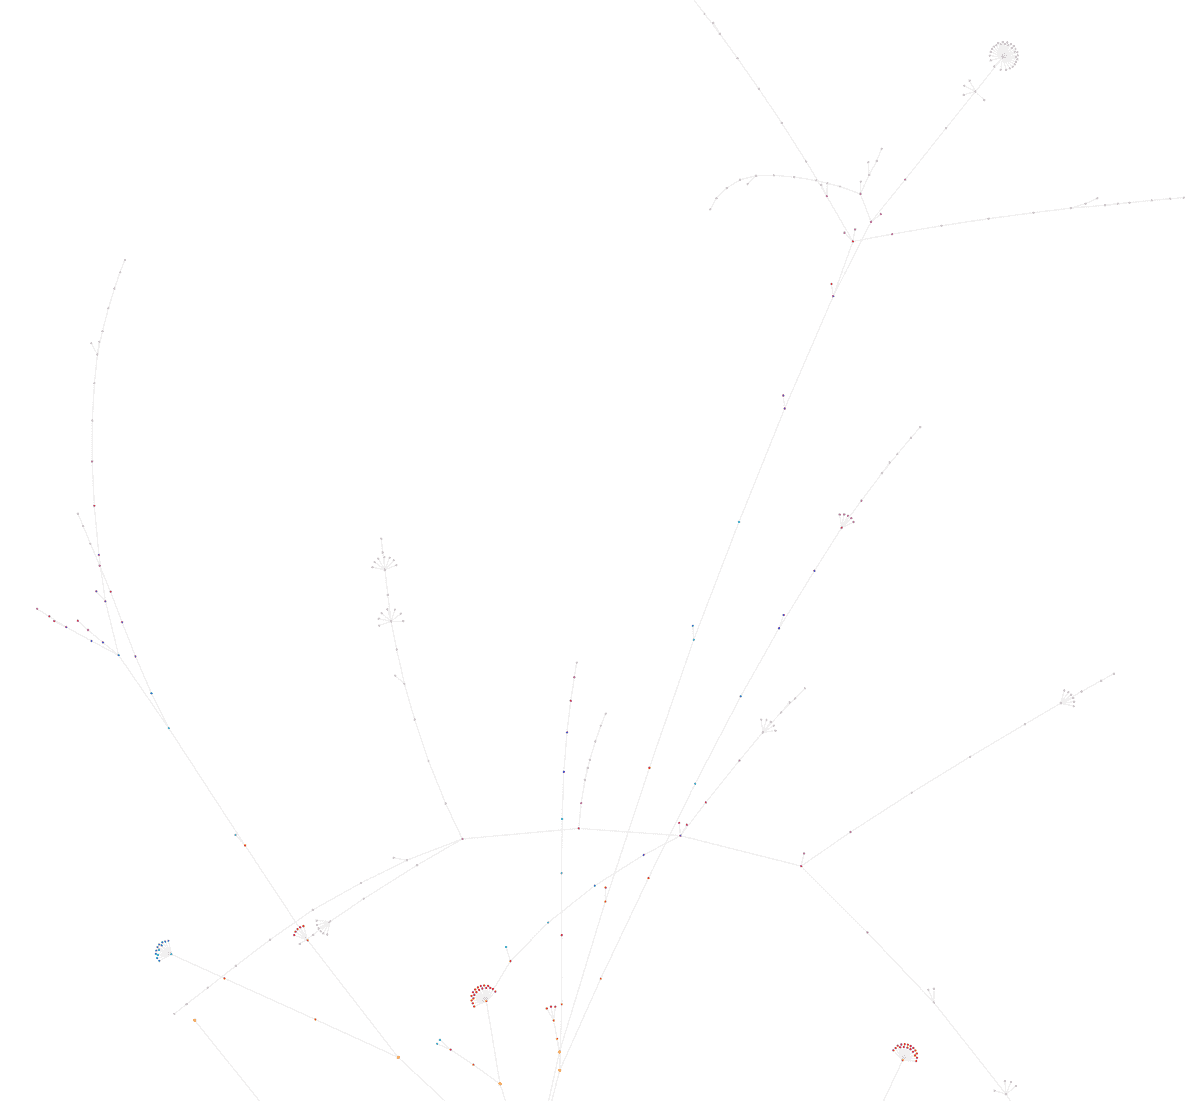
To combat this issue, we also added some rules to govern how many nodes are shown for each crawl depth (level).
For example, these are the rules used most of the time:
There are slightly different rules used when the node count increases over 10,000 and 20,000, such that less nodes are shown.
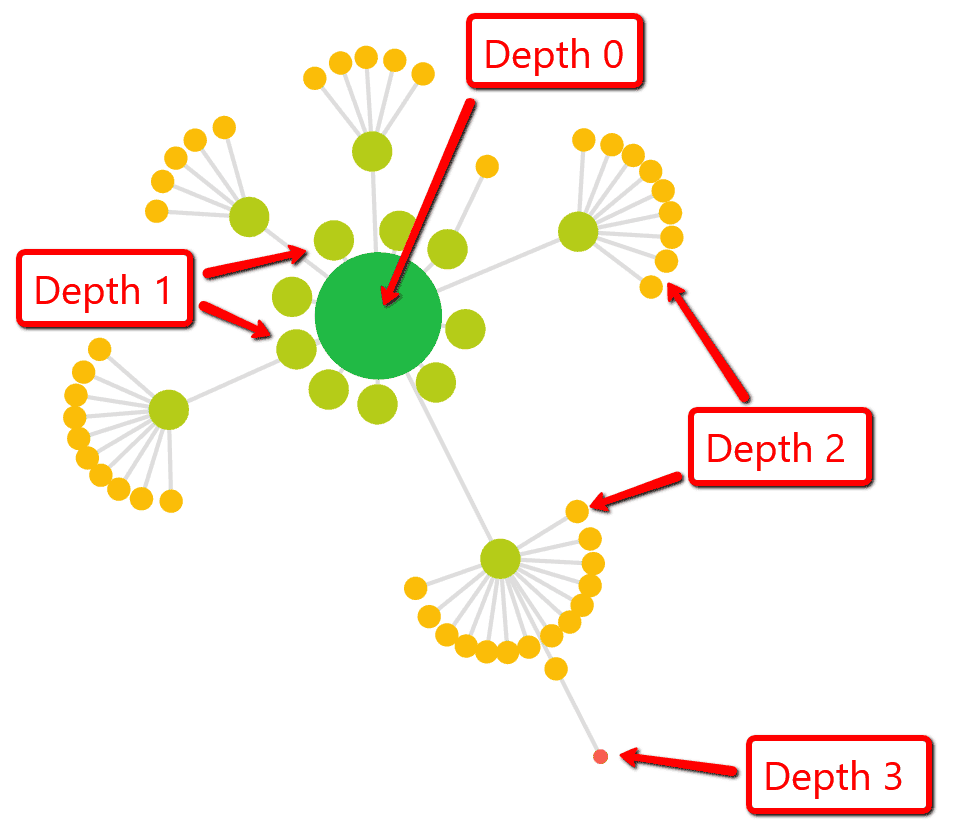
Both the colour and the size of each node reflects the crawl depth (level) of the URL in the website crawl.
So the big green node is Depth 0 (the homepage), the lighter green nodes are Depth 1 (URLs linked from the homepage), and so on and so forth.
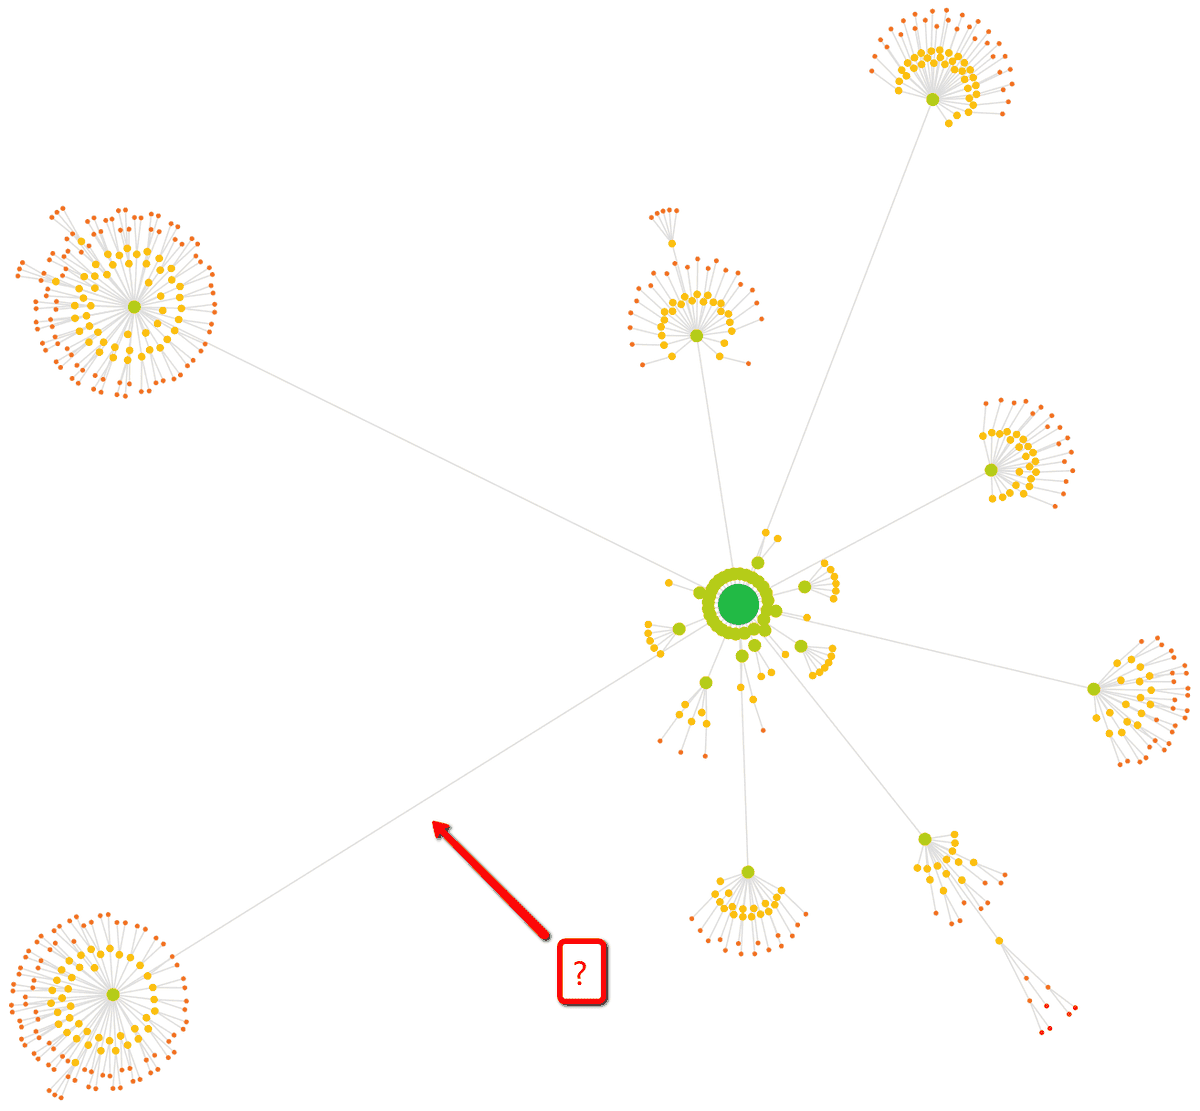
The distance between nodes (i.e the length of the lines) does not signify anything.
Some lines are bigger than others simply as a means to arrange the content of the graph and fit it all in.
This can happen for a number of reasons, normally due to the technical setup of the website in question.
Crawl Maps only include indexable URLs, so if you have a canonicalized homepage you can end up with an empty Crawl Map. Similarly, if you have lots of nofollow or canonicalized URLs linked from the homepage, the mapping of the Crawl Map may be stunted.
If you think your Crawl Map is missing major chunks of your website, then you can typically find the answer by looking at how canonicals are used across the site (see the Indexability report).
No. It is a visualization of the crawl carried about by Sitebulb.
Sitebulb uses a breadth-first search (BFS) method in order to crawl your website. This means that when it crawls your homepage (depth 0), it finds all the links and adds these to the crawl scheduler. All of these pages will be depth 1, as they are linked directly from the homepage. Sitebulb will crawl each of these depth 1 pages, and extract all of their links (to depth 2 pages), completing all depth 1 pages first before moving on to the depth 2 pages.
It is this process that is mapped by a Crawl Map, so it can be considered a representation of your site architecture, but it is not a sitemap.
Sure! You'll find it below. First, here's a quick shot to remind you of the data we display:
