Optimizing on-page content is one of the pillars of any effective SEO strategy. With each website crawl, Sitebulb analyzes your website content and can help you identify opportunities for improvement.
The On Page report is part of the Search Engine Optimisation audit, which will be selected by default when you start a new project. - The report contains data regarding title tags, meta descriptions, and h1 headers length and identification (missing, only one, more than one).
To make this audit more comprehensive when analyzing your on-page content, you can enable a few optional settings when creating your audit.
Ticking the Check Readability option within your Search Engine Optimization advanced settings will provide you with data on where your pages fall within the Flesch Reading Ease Scale. It will also analyze on-page text against the AFINN-111 Sentiment Index.
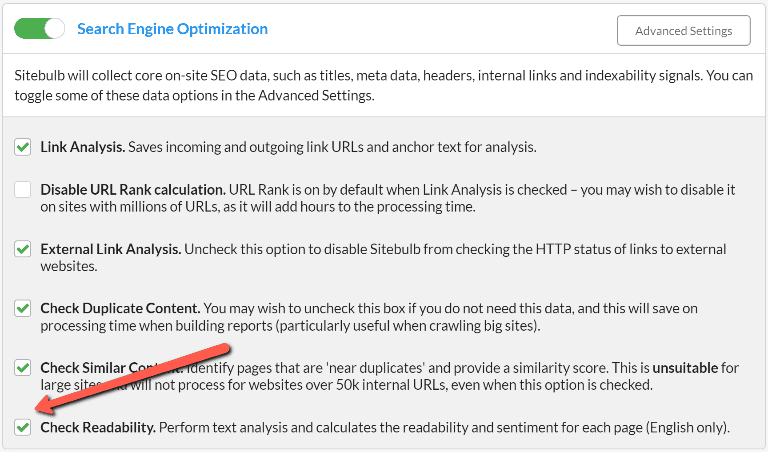
*Note: currently both of these checks apply to English language only.
Enabling the Page Resources audit will add data about image alt text to your On Page content audit.

Once your audit is complete, you will find the On Page report on the left-hand side menu in Sitebulb.
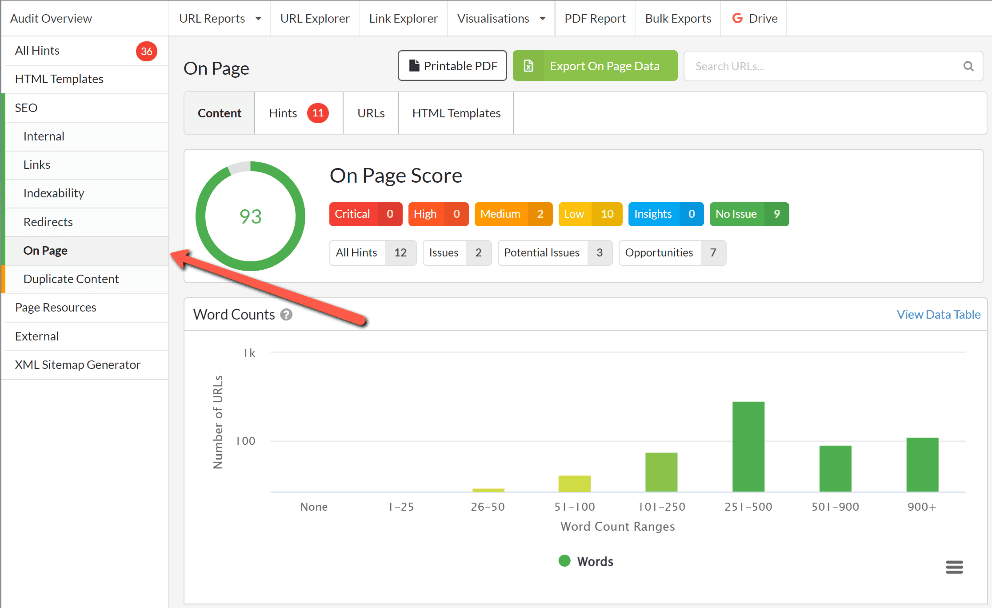
Once you navigate to the report, you’ll see key data summarized within a series of graphics.
The first table you will encounter in the report shows the word count distribution across all audited URLs. This can help you instantly identify pages with low or no word count.
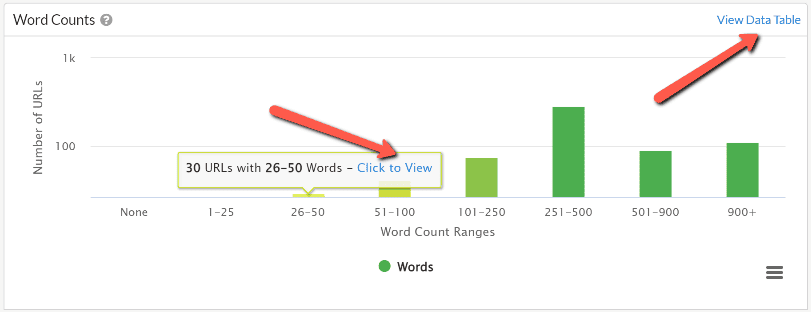
You can view each of these graphs in table form by using the View Data Table button in the top right corner, or navigate directly to the URL list for each metric through the Click to View button that appears on hover.

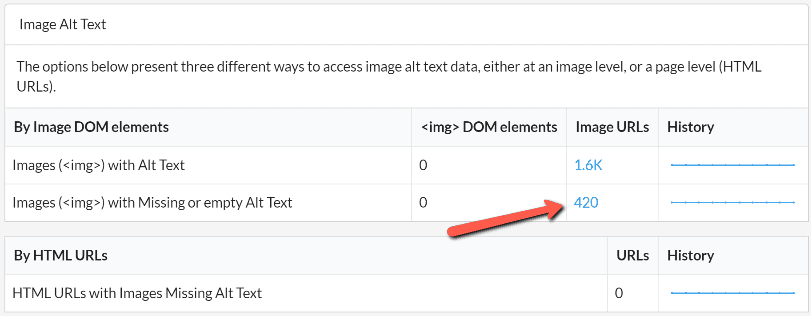
If you have enabled Page Resources within the audit setup, you’ll see data about your Image Alt text in this second table. You can navigate to the URL list containing all images with missing Alt text from here.
Next, you’ll find the Readability & Sentiment graphs (dependent on enabling the corresponding setting in the audit setup process).

The Readability report graph qualifies each analyzed URL in one of six readability bands, using sentence length as word length to score each URL according to the Flesch Reading Ease Scale. This will help you identify pages containing content that could be made more accessible to your users by increasing the clarity of the copy.
The Sentiment report graph qualifies every analyzed URL into four sentiment bands, ranging from ‘Negative’ to ‘Very Positive’. The sentiment is measured by analyzing each word on the page against the AFINN-111 index.
The remaining graphs in the report overview group analyze URLs according to the title tag, meta description, and h1 heading length and identification. Just like with the graphs above, you’ll be able to view these as data tables and navigate to the corresponding URL lists from the graphs.
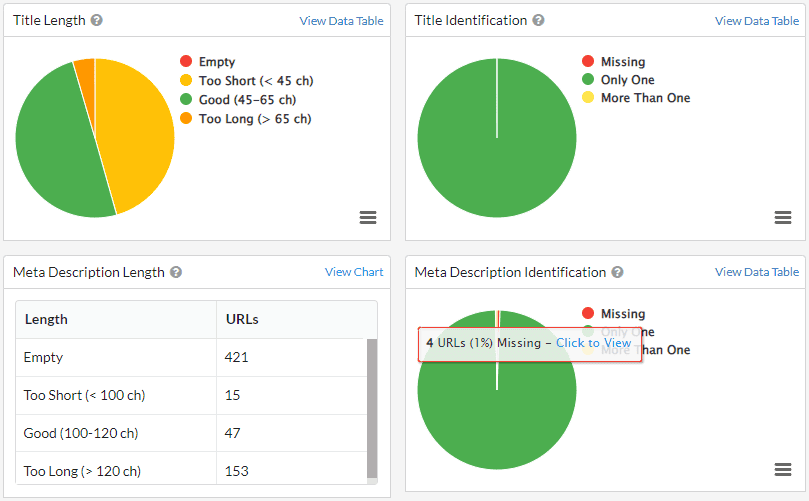
There are many ways to use and analyze the on-page content data within Sitebulb.
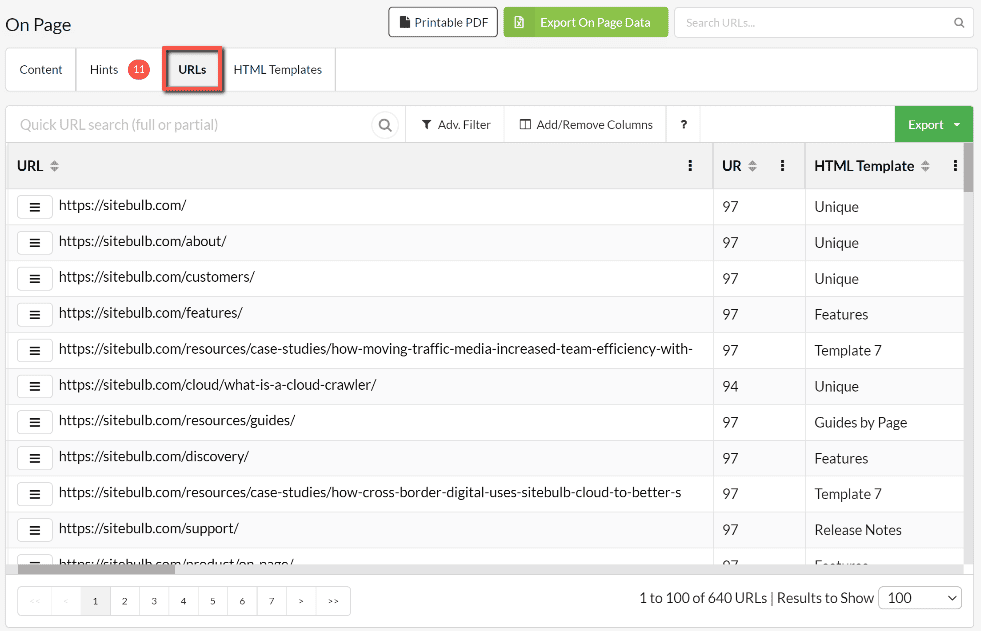
From the report overview, click the URLs tab to navigate to the main URLs list, where you’ll find all the analyzed URLs alongside key data. By default, the table contains all your titles, meta descriptions, and h1 content, as well as information about h2s, word counts, reading time, readability, and sentiment.
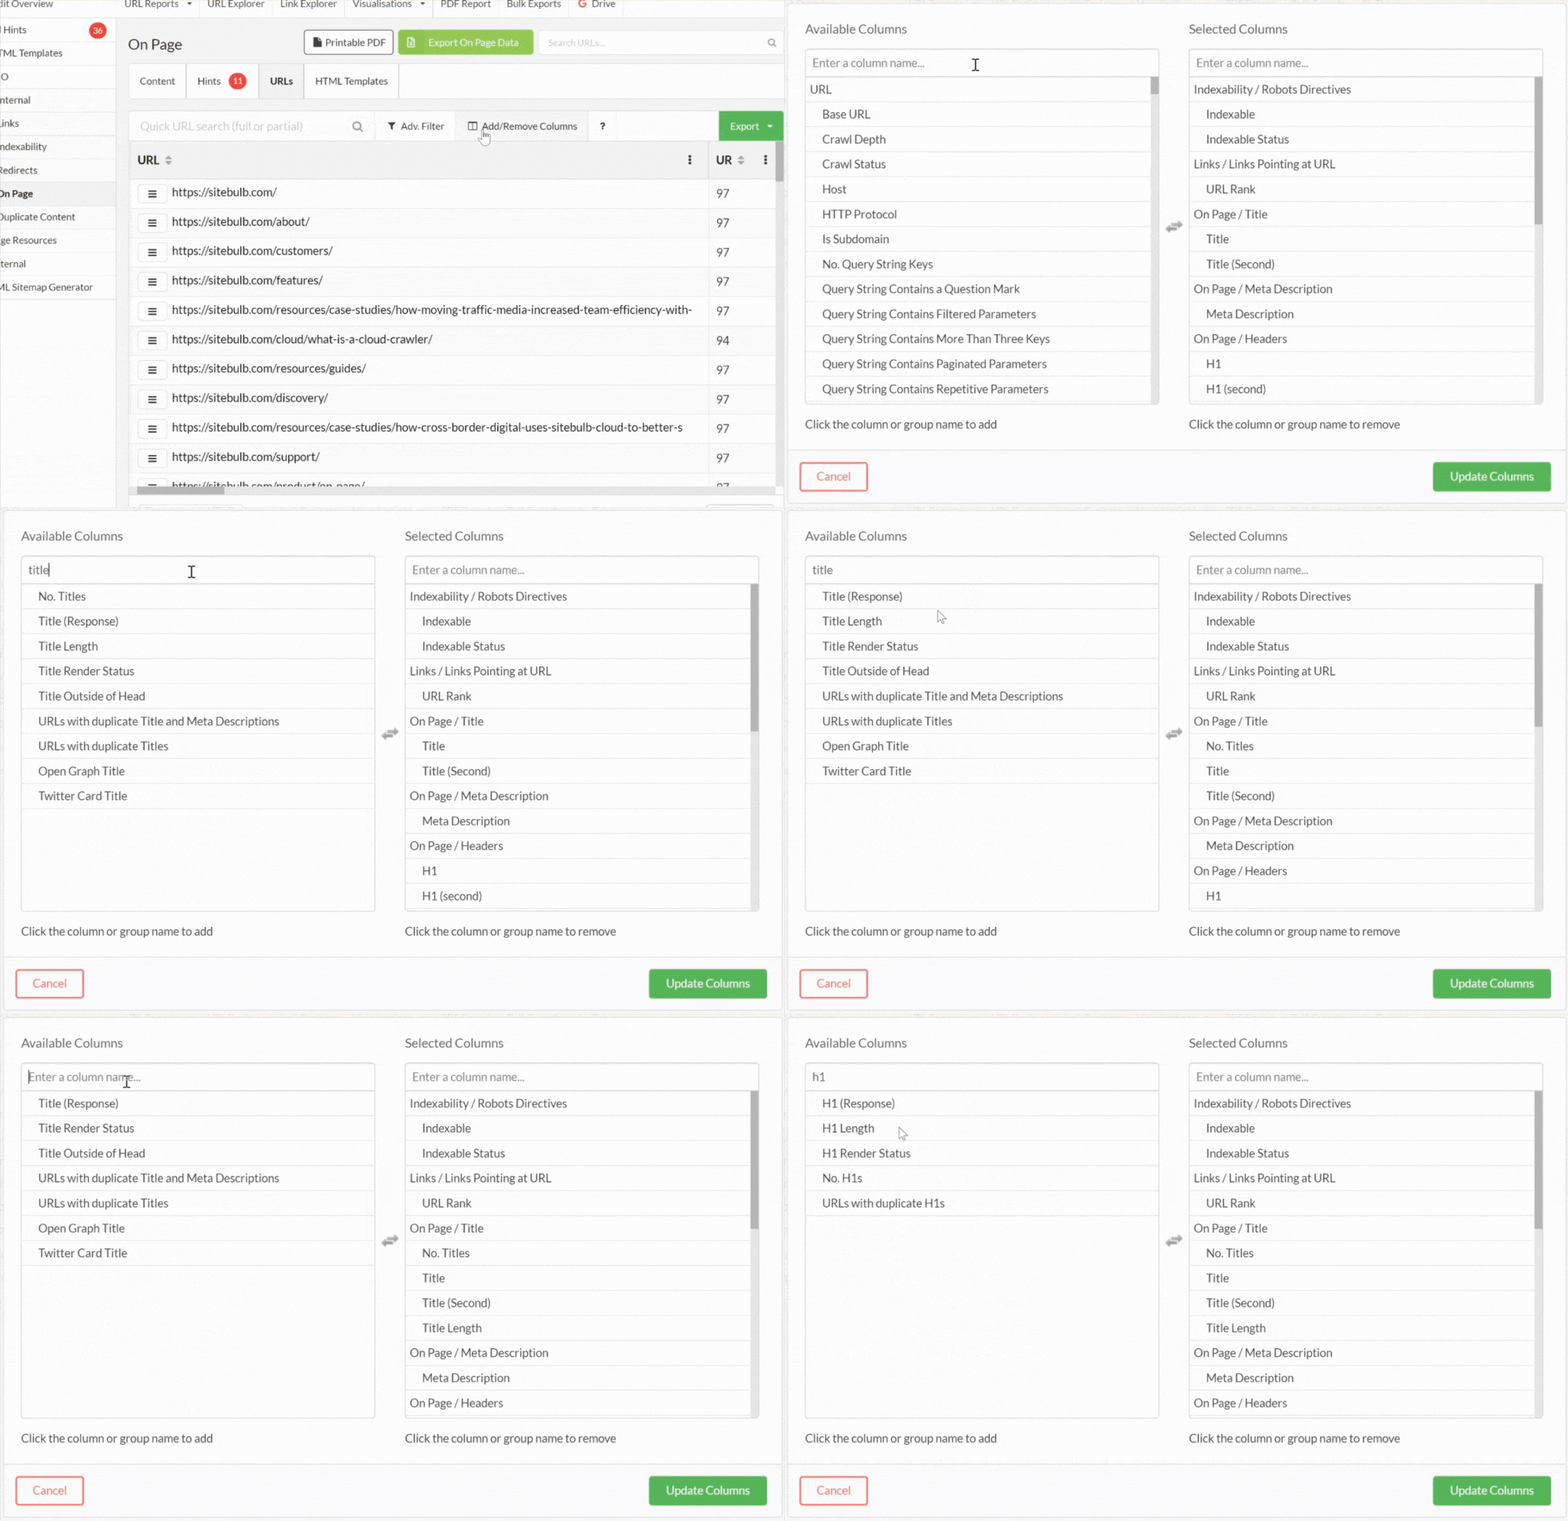
You can add and remove columns and use advanced filters to customize this data table as best suited for your project.
You will also be able to add the columns corresponding to this data within other URL Reports and explorations in Sitebulb.
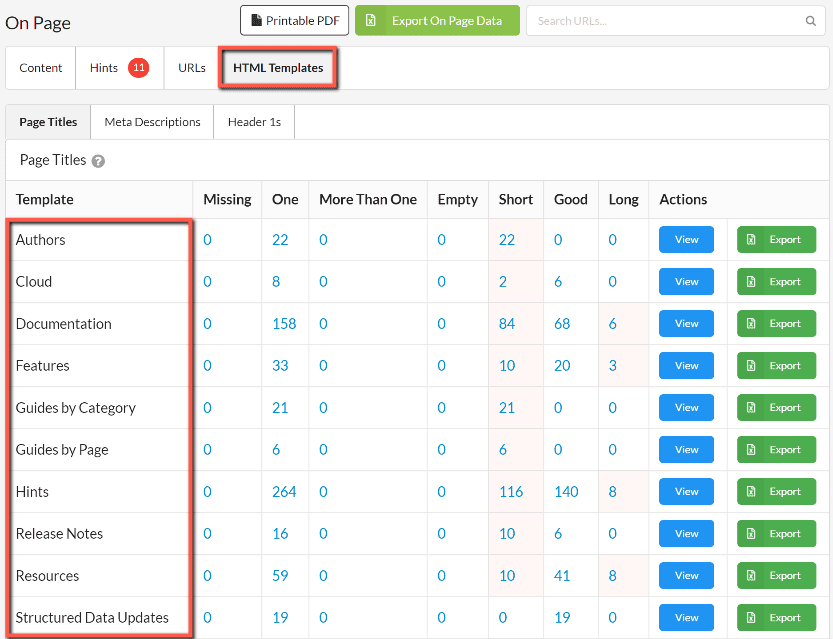
The HTML templates table aggregates the status of titles, meta descriptions, and h1s by page template. This view should allow you to quickly identify patterns with issues that may be related to your page setup or particular website folders.
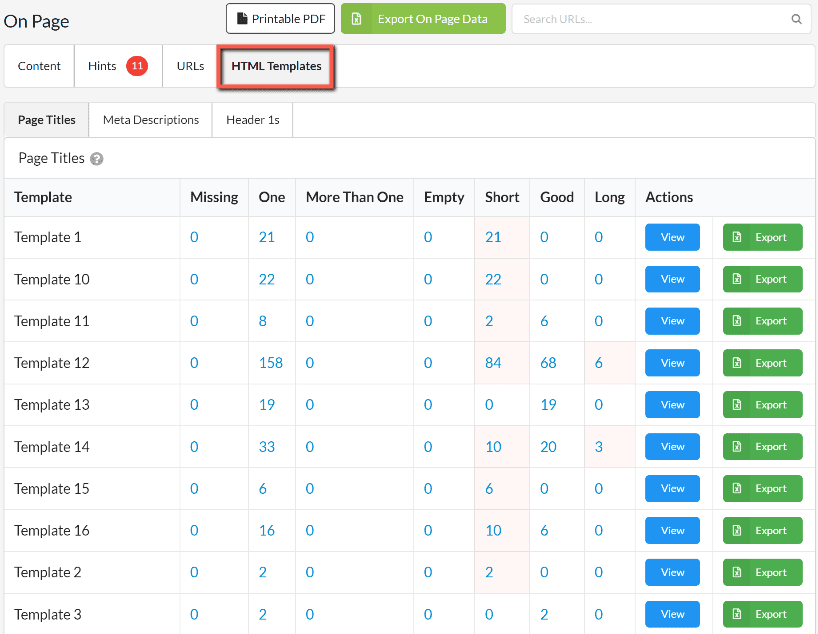
To enrich the usability of this view, you can rename your templates according to their use. Follow this guide to learn how to use and rename HTML templates.
The On Page report summarizes the issues found during the crawl in a series of useful, prioritized Hints. You’ll find these by navigating to the Hints tab from the top of your report overview.
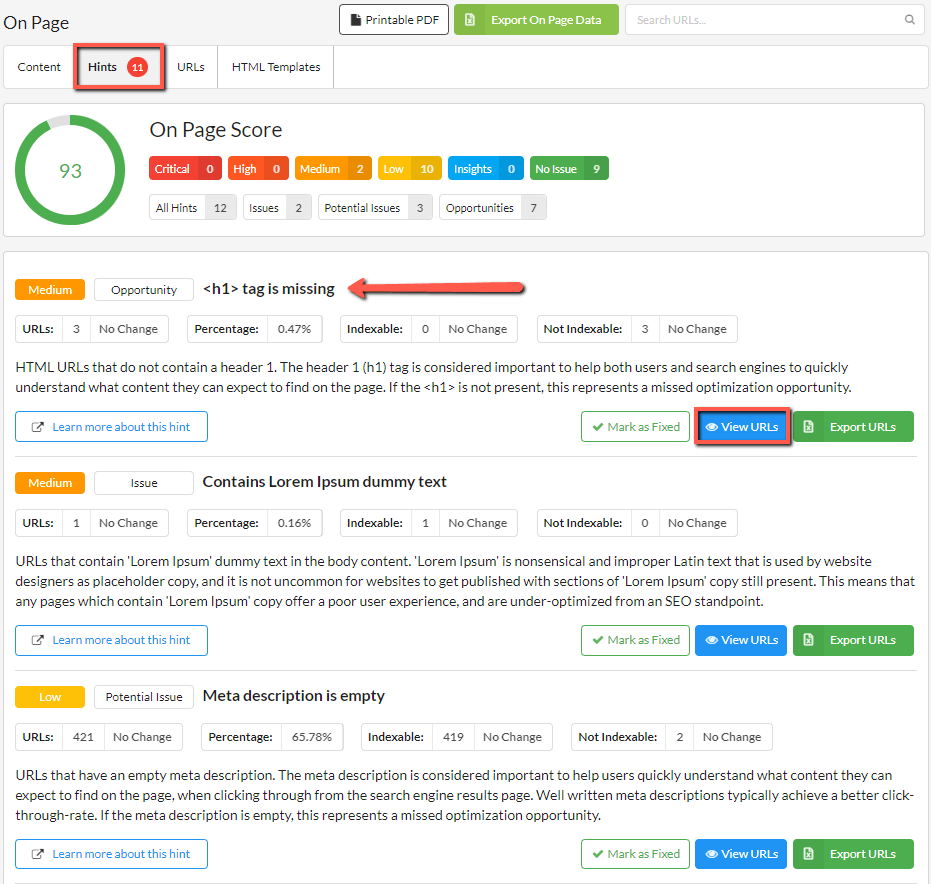
Find more about the importance of each hint with our hint documentation.
Sitebulb analyzes metrics such as title tag length against a series of predefined figures. To customize your report and hint trigger thresholds, you can edit these figures from your global settings, which you’ll find in the top right corner of your Sitebulb window, next to ‘Your Account’.
These settings determine how page titles, meta descriptions, and H1s are classified in the On Page report.
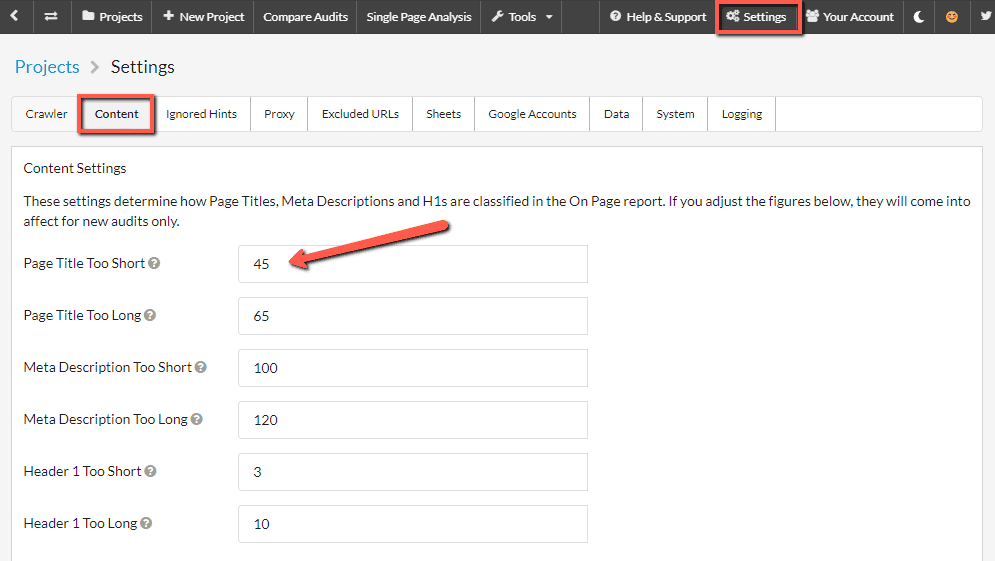
*Note: These settings will come into effect for new audits (those performed after changing the settings) only, and they will apply to new audits across every project in your account.