Sitebulb integrates with Google Search Console and Google Analytics, giving you the option to pull through keywords and performance data that adds an extra layer of insight to your audits.
The Keywords report breaks down the data obtained from Google Search Console into visual graphics and useful URL lists.
To gather keyword data in your audit, you’ll need to connect Sitebulb to your Google Search Console account and enable the respective settings.
Under Audit Settings, enable the Google Search Console audit and connect to the correct account and property.
If you have already authorized your Google Account, you will be able to select it from the drop-down menu. Sitebulb will pre-select the property from your account by matching your audit’s start URL.
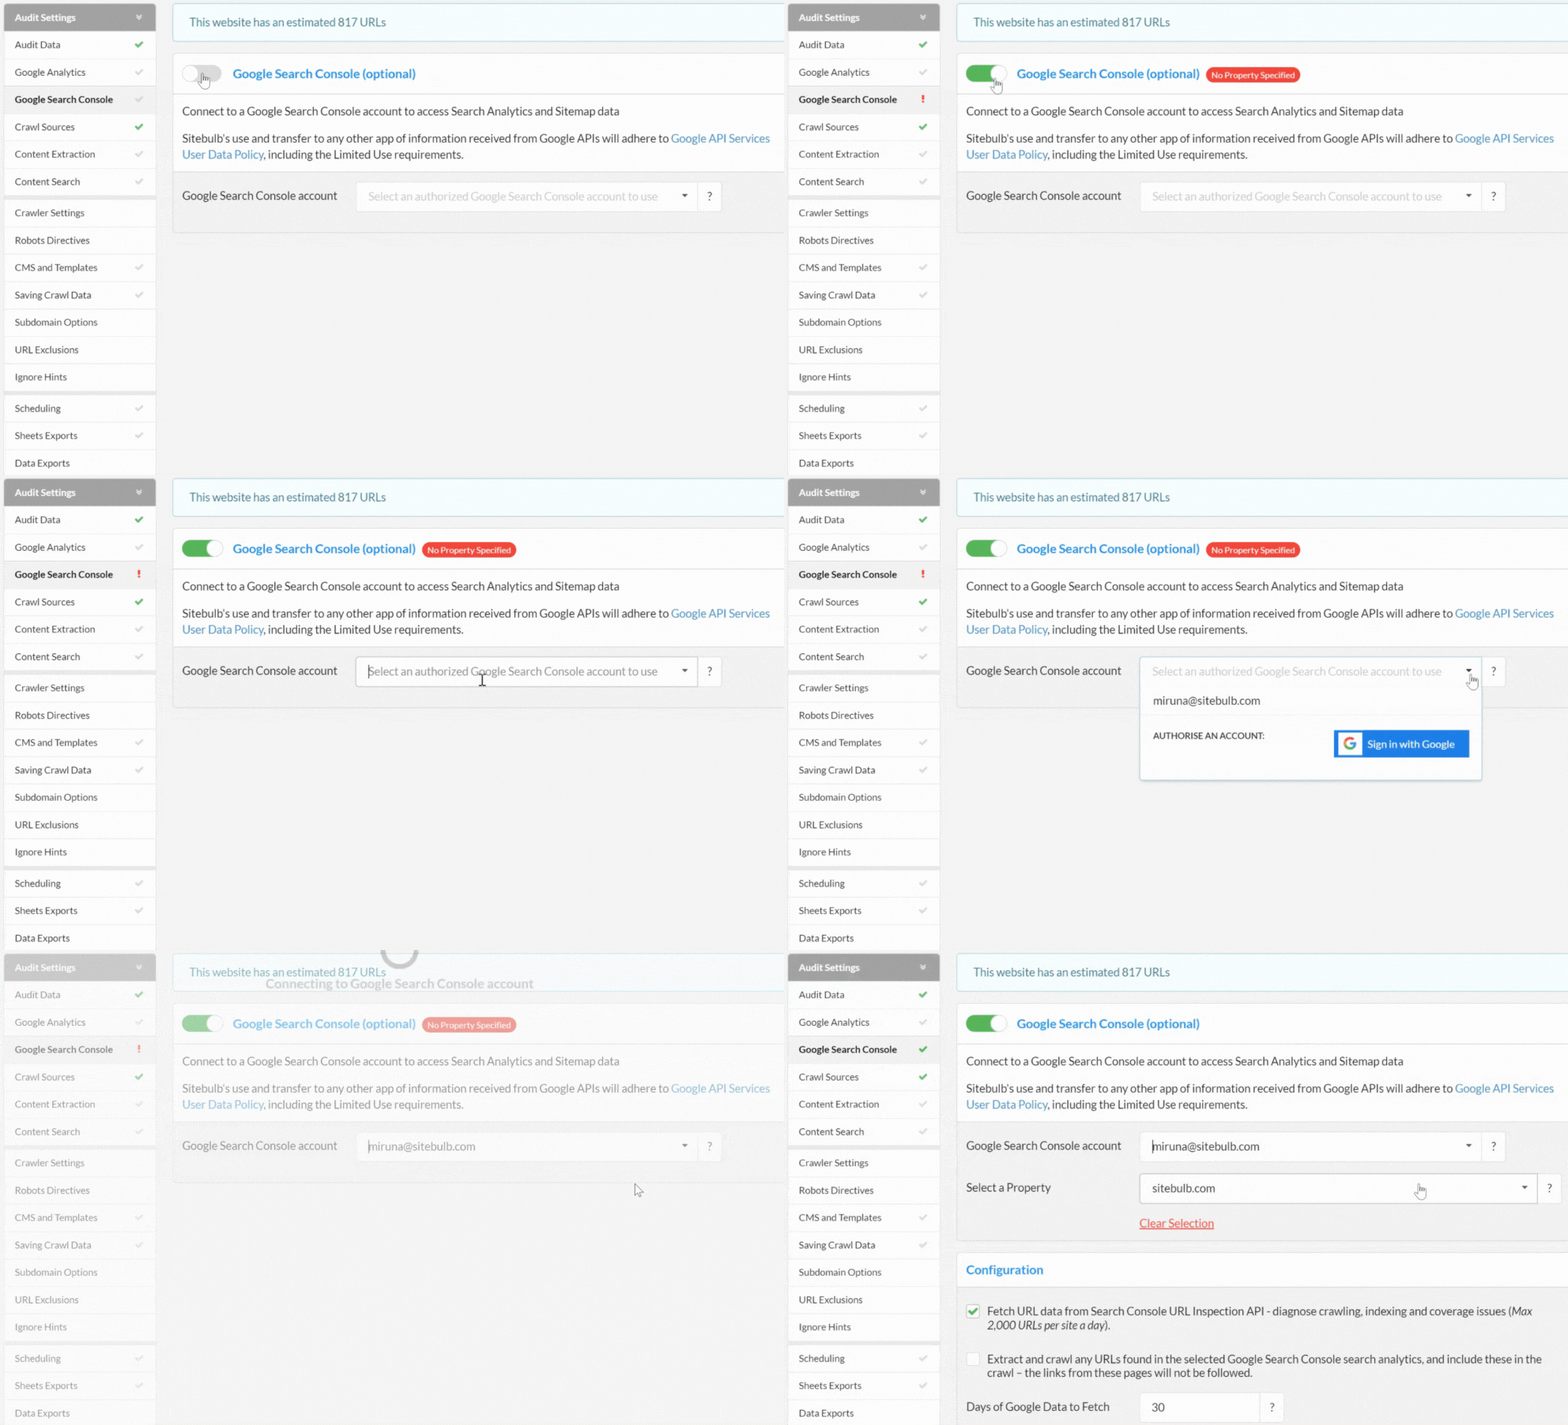
* Note: If you have multiple properties for the same website (e.g. domain and URL-level properties), you’ll need to make sure that the correct property was selected.
If you have never connected your Google Account to Sitebulb before, you will need to authorize your account before you can go ahead with the next steps.

Once you have connected to the relevant Google Search Console property, scroll to the bottom of the page and enable Keyword Analysis.
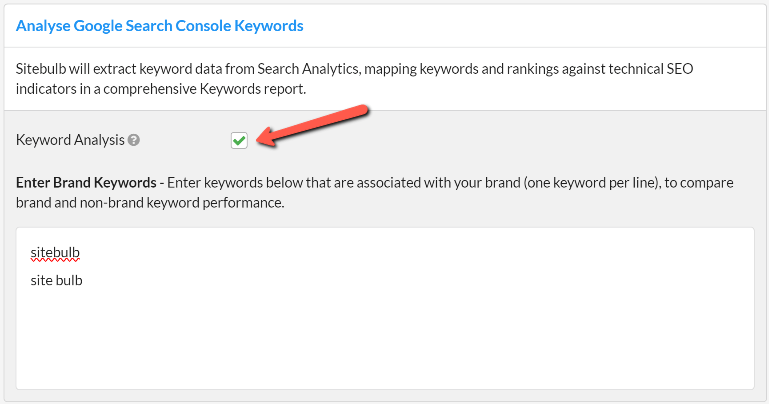
You also have the option to set Brand Keywords here, which will enrich your Keyword report. Make sure to add variations of your brand name that users may be using to find you.
* Note: Sitebulb will count any keywords containing the terms above as branded. So by adding ‘Sitebulb’ to my Brand Keywords list, I am also ensuring that variations like ‘Sitebulb download’ and ‘sitebulb.com’ are marked as branded keywords in the resulting reports.
Once your audit is complete, you’ll find the Keywords report on the left-hand side of your audit menu.
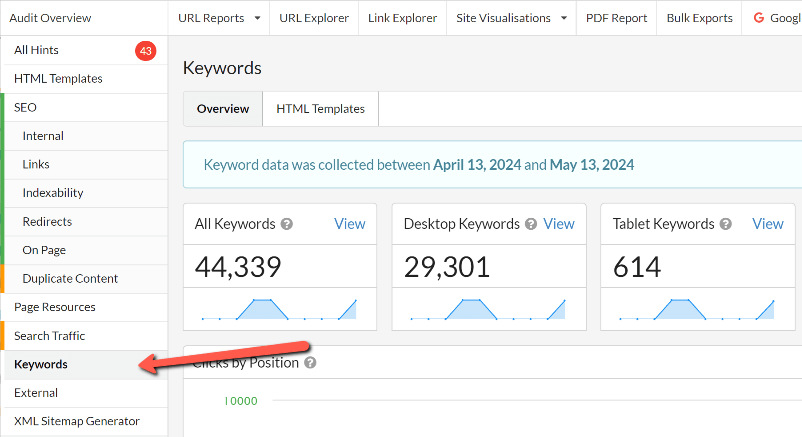
The Keywords report overview contains a variety of charts and graphs that visualize your keywords distribution by device and across branded and non-branded terms.
You can navigate to the corresponding keyword lists through the View buttons on the summary boxes at the top of your report.

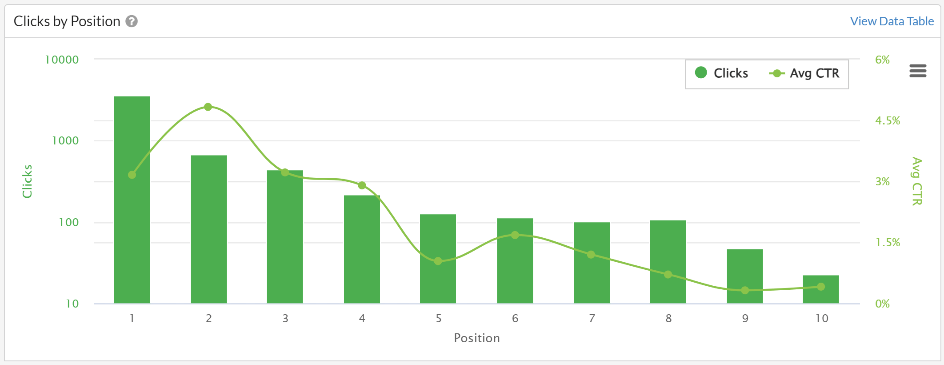
The chart below maps clicks and CTR for all keywords within the top 10 ranking positions, helping you understand how your click metrics are distributed according to your position in rankings.
The pie charts in your Keywords report visualize the following data:
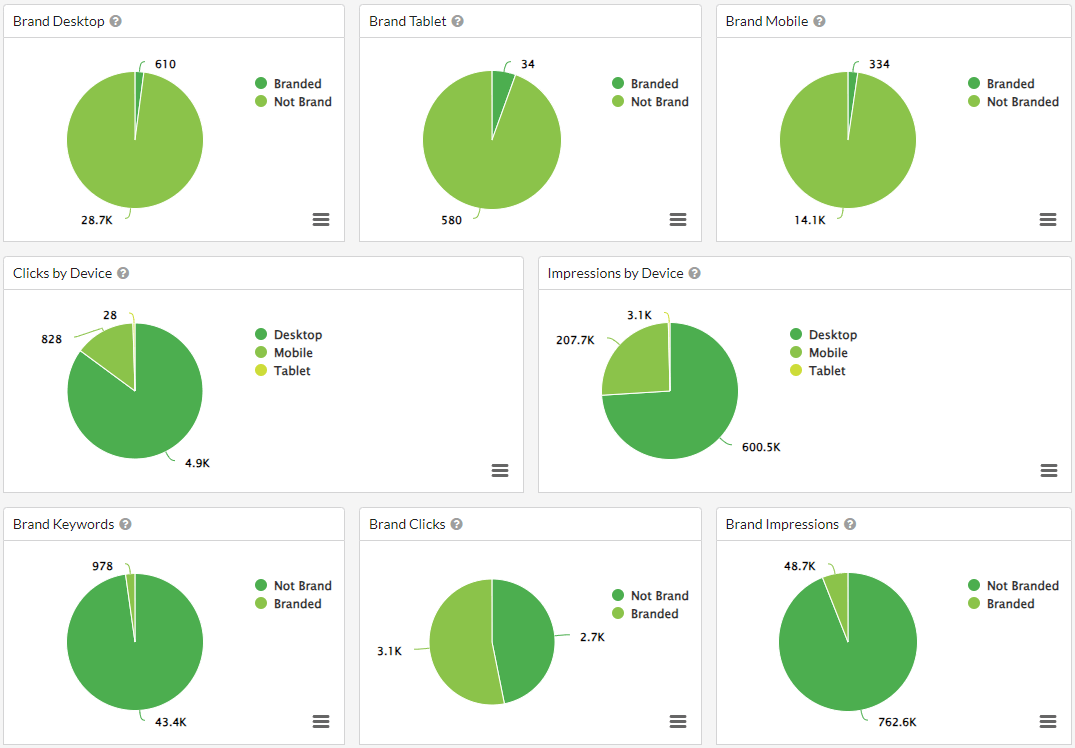
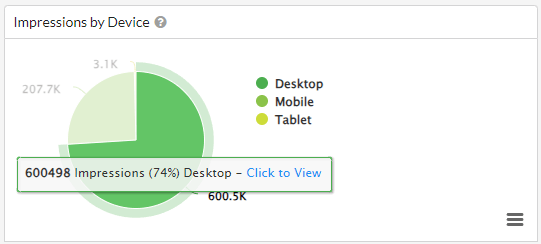
As with all Sitebulb audit graphs, you can isolate and analyze the data for each segment by clicking through the corresponding URL List.
The keyword report also provides a breakdown of performance by HTML template. If you have named your templates, this view can help you spot patterns and identify what areas of your website are driving visibility and traffic, and which may be underperforming.
Follow this guide to learn how to use and rename HTML templates.
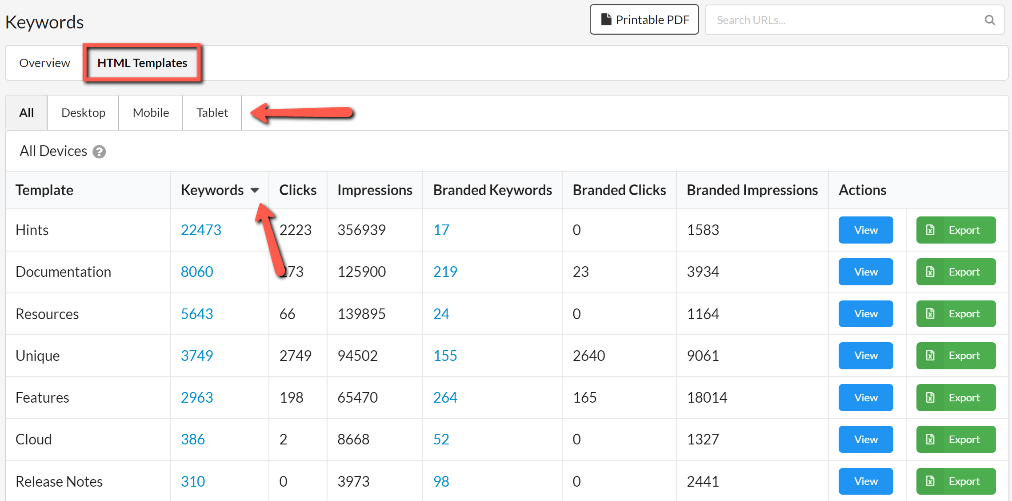
You can use the tabs at the top of this report to see the data breakdown by device and sort your data rows in ascending or descending order from the column headers.
Once you have run your Keywords audit you’ll be able to manipulate this data in a number of ways, including overlaying your GSC keywords and performance data with technical and on-page data from your Sitebulb crawl, by using the advanced filters and sorting options, adding and removing columns.
Some examples include: